Find out how to use the Data Dictionary within Insights
Have you ever been looking at a report in Insights and have no idea what data you are actually looking at or what the column name refers to?
You are not alone!
We understand that there is a lot of data in Insights and making sense of it can be a little tricky.
If you are an Insights user, you have access to something called the 'Data Dictionary' which can help to make sense of what you are looking at on-screen.
To access the Data Dictionary, open up Insights and select the 'Report Manager' section on the left-hand side: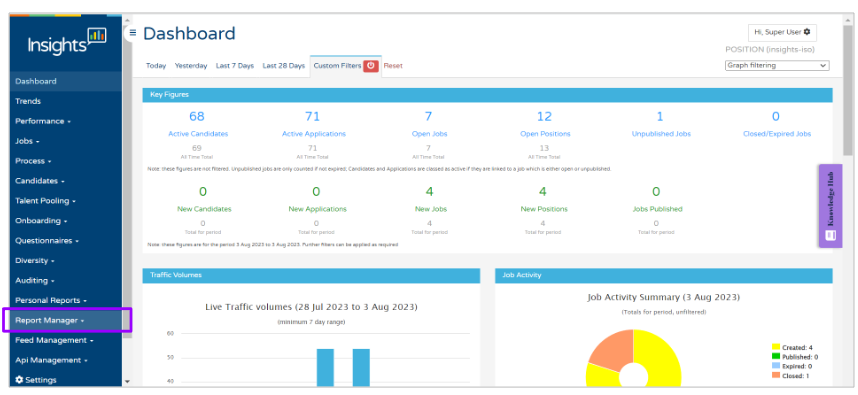
Select the 'Report templates' drop-down option:

And select the 'Data Dictionary' option:

You will be presented with a screen that looks like this:
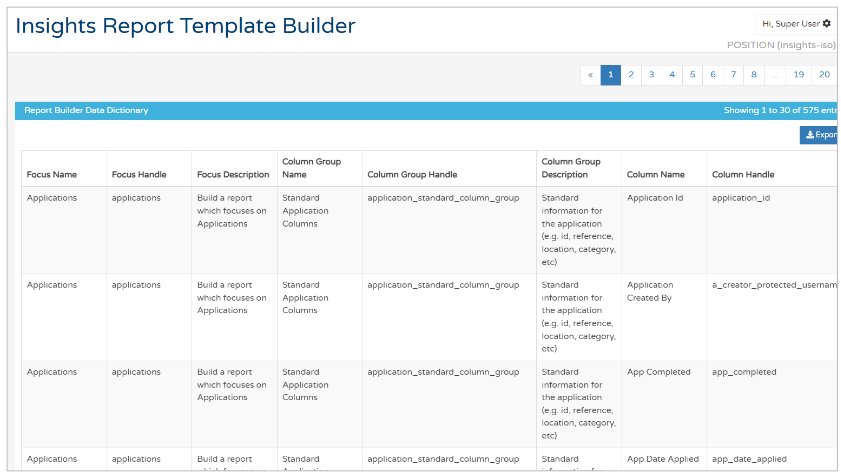
The column headers on this initial page refer to aspects that are selected when you are creating your own report:
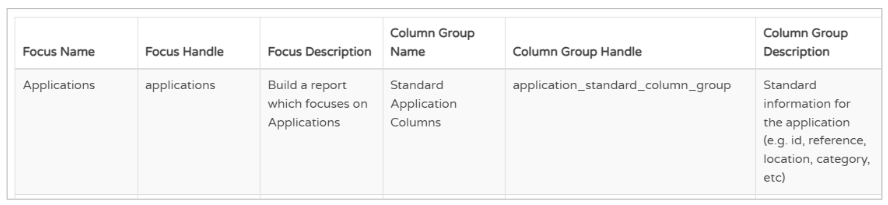
- Focus Name - When creating a report, you must give it a 'focus' - this would be Applications, Jobs or Recruiters
- Focus Handle - The internal name for the focus
- Focus Description - What your report would focus on when created
- Column Group Name - Again, this relates to when you are creating your own report
-
- All columns in every report are grouped together according to relevance
- When creating a report, you need to select a Column Group in order to get specific columns
It is useful, when planning what columns you wish to include in a Custom report, to make a note of this Column Group name.
- Column Group Handle - The internal name for the column group
- Column Group Description - A description of what the columns in the group relate to
Further over the page, you will see the following columns:
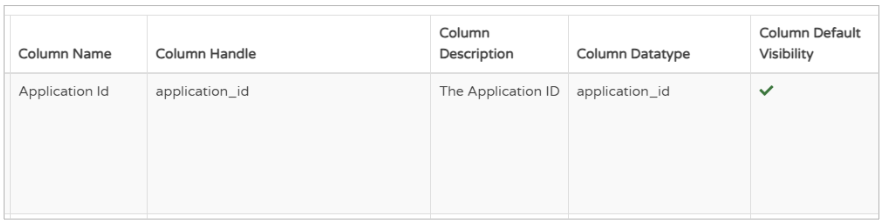
- Column Name - This is what you will see at the top of any column on any report
- Column Handle - The internal name for the column
- This is not something you will need to worry about as it sits in the background and allows the information in the foreground to be presented in a specific way.
- Column Description - This is where you will find information on the data that is being presented
This is useful if you are
a) Querying what information is being presented and needing further explanation
b) Deciding what information and columns to include when creating a report.
- Column Datatype - Similar to the 'Handle' column
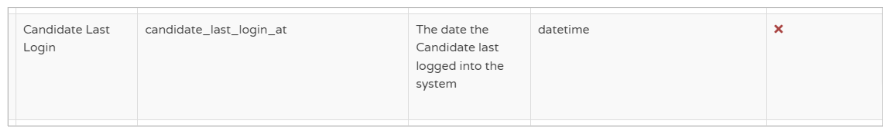
- Column Default Visibility - This indicates if the column is a default column that is shown in a report
- You may see an 'x' in this column which indicates that the column can be enabled if required:
- You may see an 'x' in this column which indicates that the column can be enabled if required:
Searching for information
As you can see at the top of the page, there are many pages of data within the Data Dictionary:
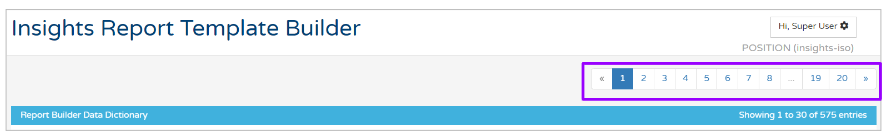
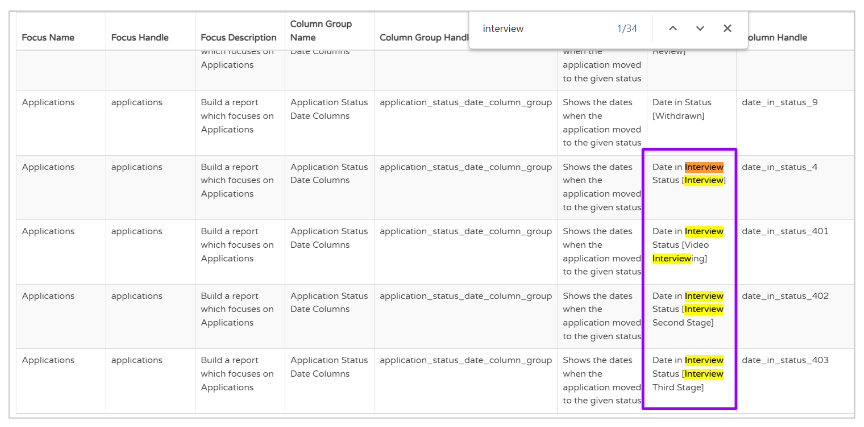
You can use the 'Ctrl + F' function to search the pages for what you are looking for.
The search function will appear at the top of the screen:

Simply click the arrows to go to the featured search items:

Results will be highlighted in yellow: