Diversity
Diversity - Candidate - Overview
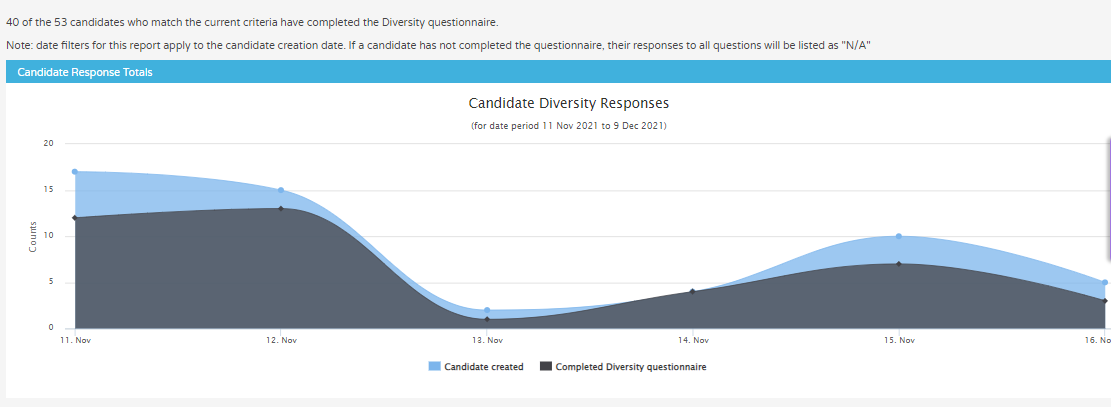
Candidate Diversity Responses - a graph that highlights candidate creation versus Diversity questionnaire completion.
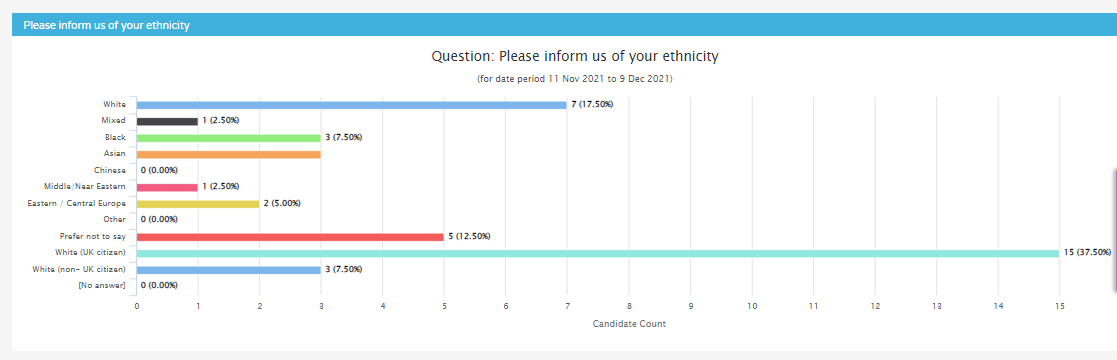
Please Inform us of your Ethnicity
A graph measuring Ethnicity type versus the percentage of candidates that have answered that question with their Ethnic type.
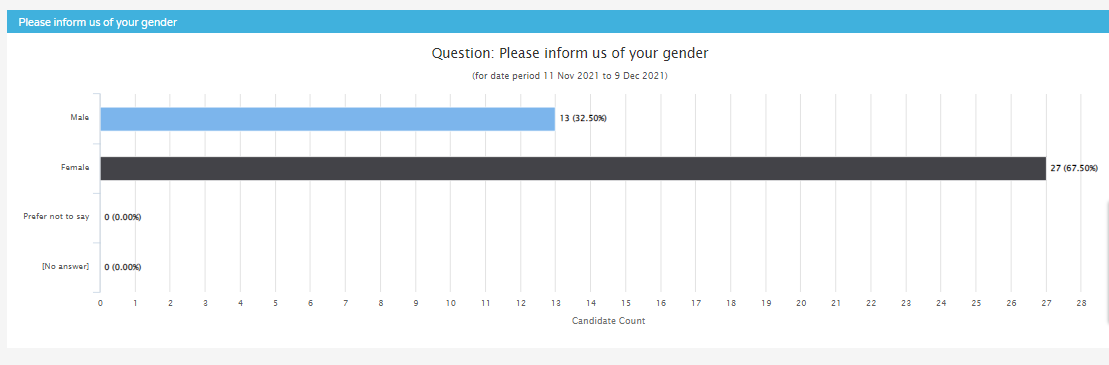
Please tell us of your Gender
No of Applicants per gender type that have answered that question or selected ‘prefer not to say’.
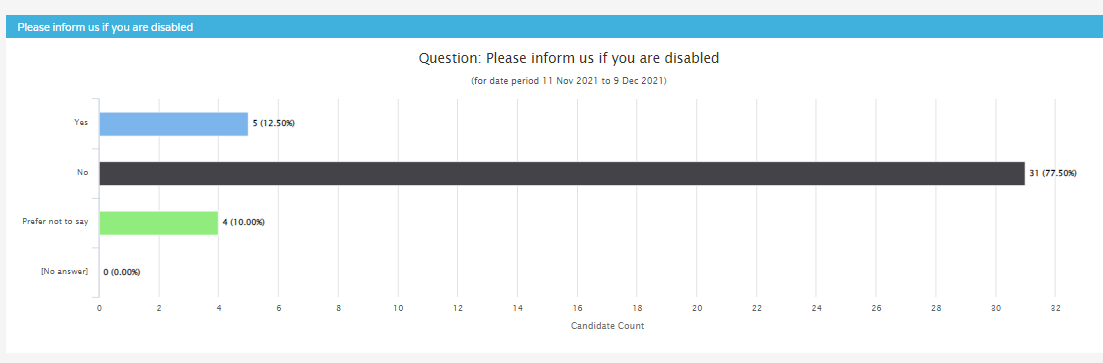
Please inform us if you are disabled
Number of Applicants per yes, no or prefer not to say response.
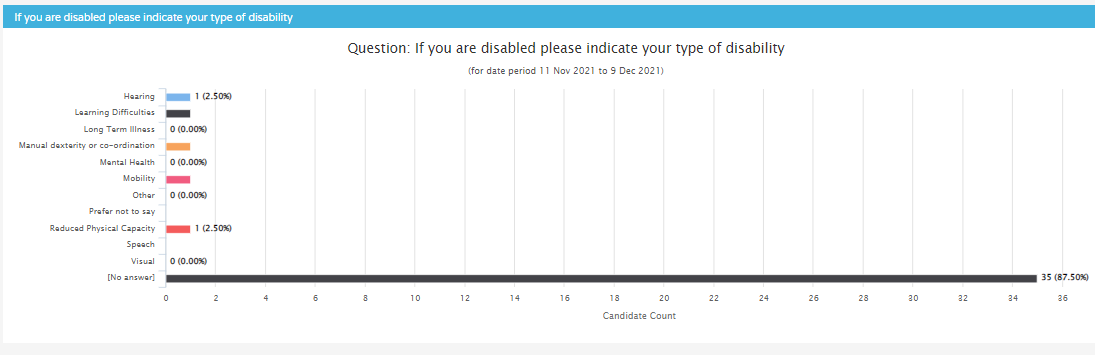
If you are disabled please indicate your type of disability
Lists the number of applicants against disability type or none specified.
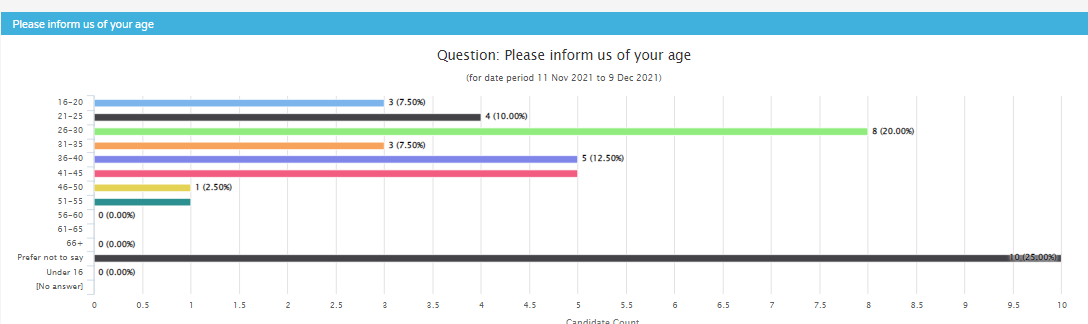
Please inform us of your age
This report shows us which candidates sit in each of the age brackets within the system.
In every report available within insights you are able to download a raw data format to be able to manipulate in excel outside of the platform. To see how to do this please see the below link to the raw data article:
Raw Data - Click Here
Also, in every report, you will have the option to be able to custom filter your data to handle this in easier chunks of information. To read up more about Custom filtering please see the link below:
Custom Filters - Click Here