Once logged into Insights, by default you will be presented with the main Dashboard.
The Dashboard provides a set of key figures, graphs and infographics:
Key Figures
The Key Figures section offers two sets of figures.
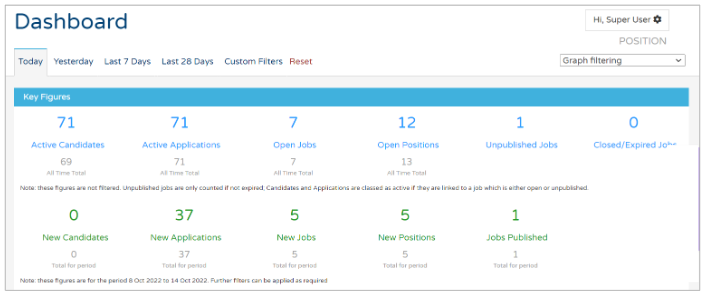
- The blue figures show the current 'Active' counts for the candidates, jobs and applications registered on the system. These figures are not affected by the filters which have been set; Candidates and Applications are classed as ‘Active’ if they are linked to a job which is either ‘Open’ or ‘Unpublished’
- The figures in grey below the blue figures show the 'all-time' totals - i.e. they do not take the candidate, job or application status into account
- The green figures show the counts for the candidates, jobs and applications which match all of the current filter criteria
- The figures in grey below the green figures show the counts for the given date period, with no other filters applied. E.g. there could have been 50 candidates created in the period, of which 30 are in the United Kingdom.
Please note the following:
- A job can offer one or more positions.
- A job will only be counted as Open if it has been published.
- Candidates can create applications for multiple jobs.
- The Application counts are separate to the Candidate counts, as some applications may have been created by existing candidates.
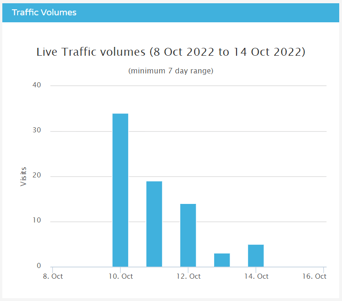
Traffic Volume
The graph shows the total number of visits to the ATS and/or Job board applications which are managed by Tribepad.
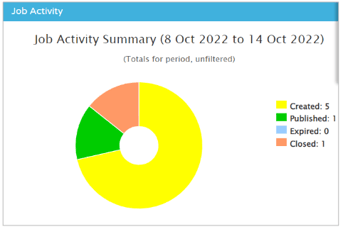
Job Details
Shows a breakdown of the jobs which match the currently defined criteria.
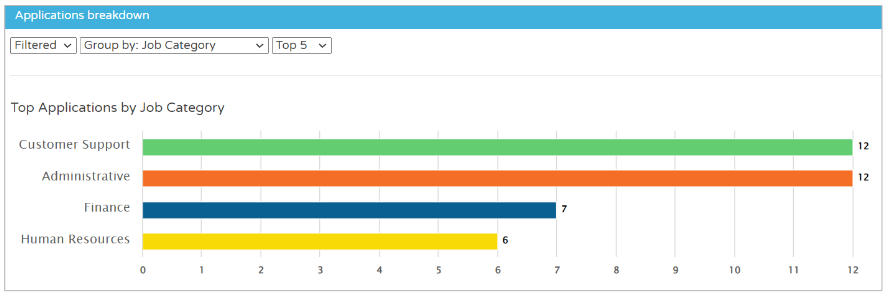
Applications Breakdown
This infographic shows a count of the applications which match the current filter criteria, grouped by one of several pivots.
Candidate Application: States
This infographic shows a count of the applications which match the current filter-criteria, grouped by the application status.
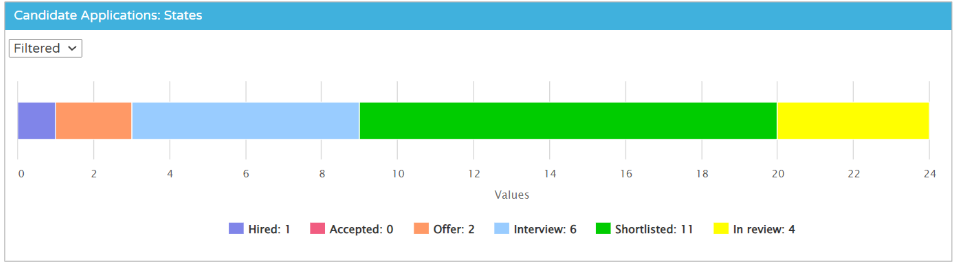
Please note that this only shows the key 'active' application states; counts for incomplete, rejected and withdrawn applications are not included.
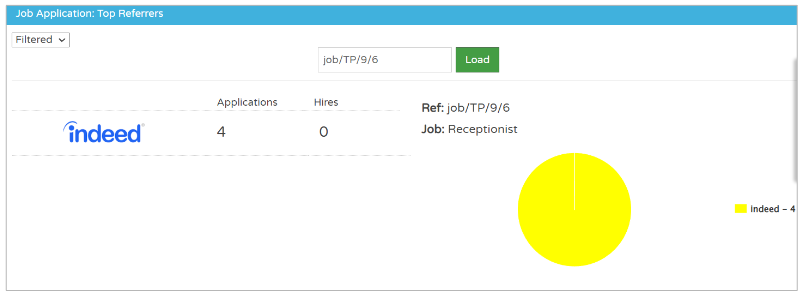
Top Referrers
This infographic allows you to review the top 10 referrers for each job
- Simply enter the Job Reference to see which of the Job Boards has referred the most applicant traffic.
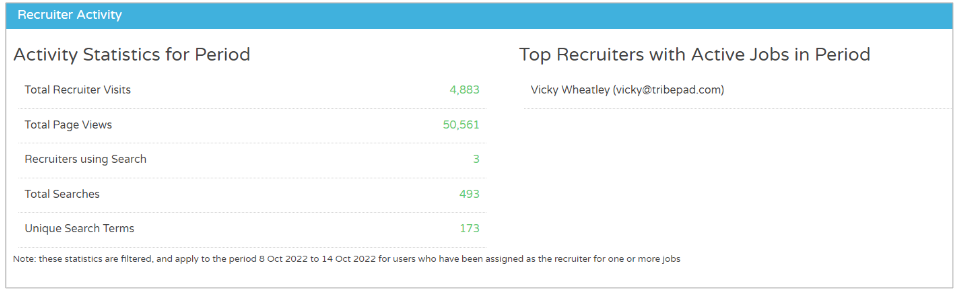
Recruiter Activity
Provides information about your top performing Recruiter, in terms of the actions that they have been carrying out within the ATS.
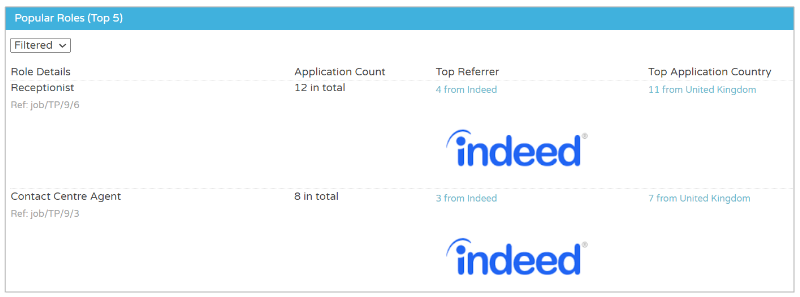
Popular Roles
Review the Top 5 most popular roles in terms of applications. You will be able to see the Job Title, Total Number of Applicants, Top Referrer and the Country of where the highest number of applicants have applied from.
Menu Bar
To navigate to other reports and configuration settings on insights you will see a list down the left-hand side of your screen. This is where you can open and run reports and also start setting up report templates