A brief overview of your Insights platform covering your Dashboard view, pre-built reports and custom filters.
Check out this video on Insights or read on for more detail:
Accessing Insights
To access Insights, you must first have the relevant user type and permissions from your organisation.
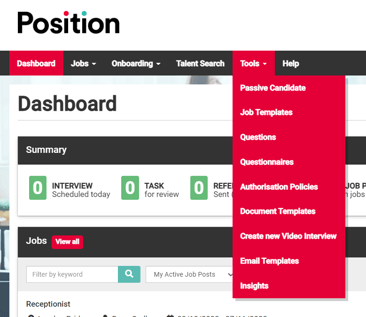
Insights is then accessed from the ATS from the 'Tools' menu:
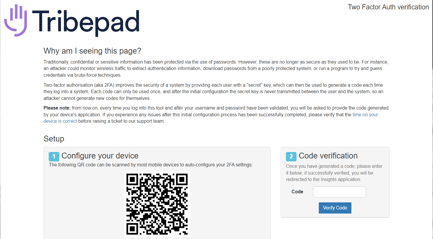
You will be asked to enter Two-Factor Authentication details
- This can be provided via email or through an Authenticator on a separate device
Dashboard
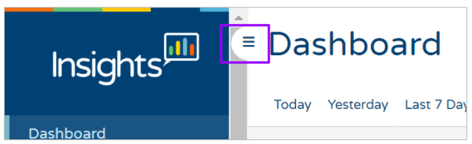
Reports on Insights are accessed via the Menu on the left-hand side of the page - this can be minimised by clicking on the 'triple bar' icon at the top of the menu. Reports are grouped by category.
Please note that some reports (e.g. Diversity) will only be displayed if you have been granted access to them.
Specific colleagues within your organisation can allow access via the Manage tool.
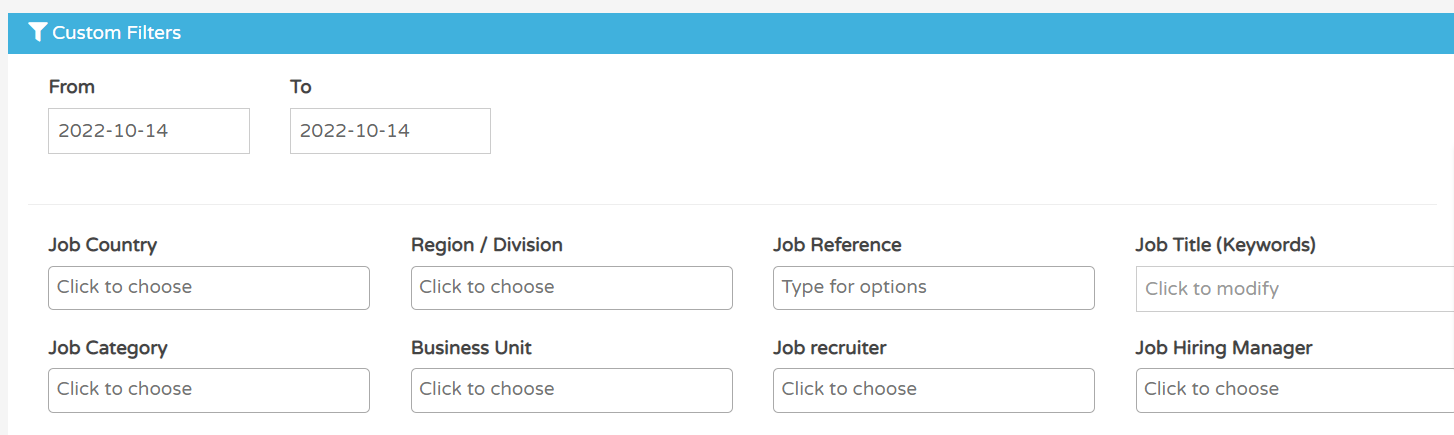
The majority of reports and infographics can be filtered to only show relevant data for a given date-range and/or specific conditions. The filters can be activated by using the tabs at the top of the page:

- The 'Custom Filter' tab allows you to enter specific date ranges and add further filters.
- The 'Reset' option returns the system to the default filter of 'Today'.
Please note - the Custom filters and Quick-date-range filters do not work together. If you wish to see a specific date or specific area of the business, as designated within the 'Customer Filter' option, this will override the quick-date-range filters.
Where available, the quick-access date filters apply the specified date range to the most appropriate element of the given report. For instance, a Job report may be filtered by the job’s creation date.
Each report will explicitly state how the date filters are used. For example:
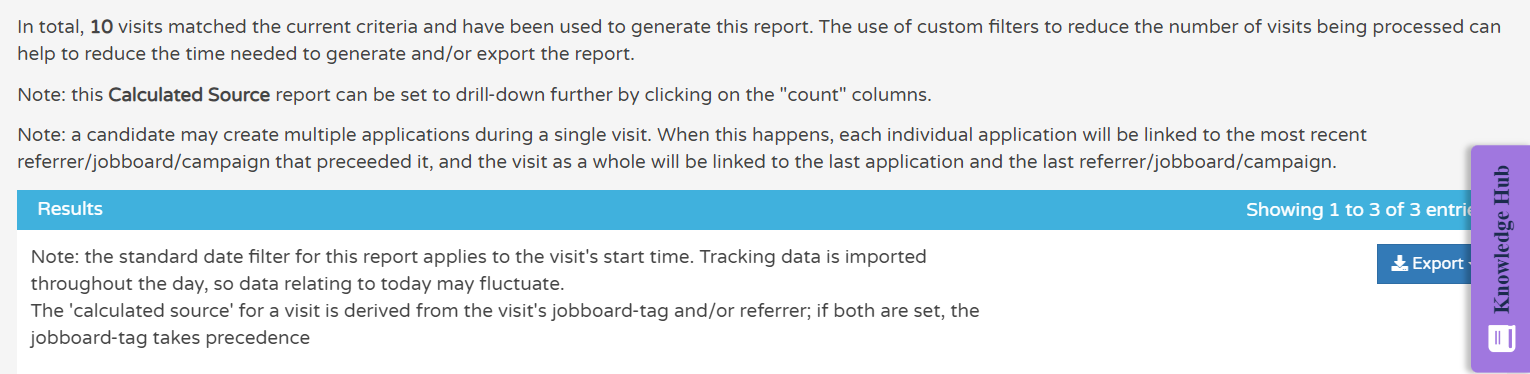
The Custom Filters vary, depending on the report being accessed - for instance, a Job report may include filters based on the job status, whereas a Source report will include filters based on the visitor’s referrer and URL tags.
Multiple filters can be specified at the same time, and many filters can have multiple options selected.
Once set, custom filters will apply to all reports being viewed; if a given filter is not relevant for a particular report, it will be ignored.
The 'Reset' option can be used at any time to restore the default filters:
Most of the infographics on Insights can be customised in one of several ways.
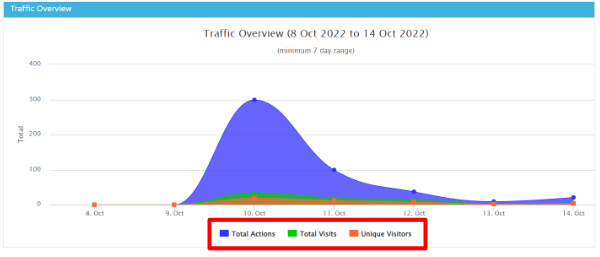
- If the infographic has a legend against it (i.e. it is in the form of a graph / chart and has an axis with options at the bottom), individual items can be hidden or made visible by clicking on the different options underneath the graph / chart:
- If you wish to download the data relating to certain infographics, you can click the hyperlink where applicable
- This will be downloaded as a CSV file where you can import it into whatever file format you prefer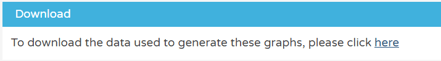
Settings
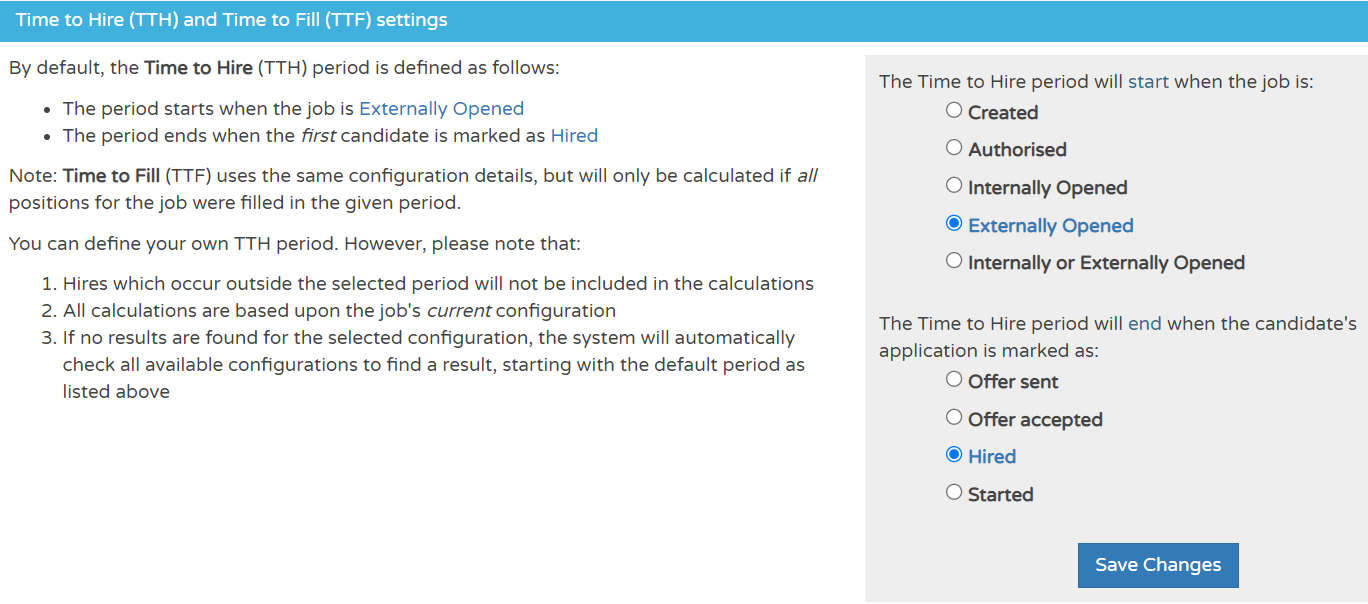
A number of Insights reports provide Time to Hire (TTH) and Time to Fill (TTF) calculations. As there are several ways in which these figures can be calculated, Insights allows users to choose their preferred calculation method.
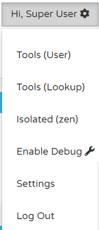
This can be done by accessing the Insights Settings page, either from the menu, on the bottom left-hand-side or the 'cog' menu at the top-right of the screen.
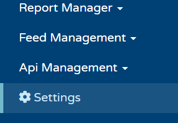
- Scroll down to Time to Hire (TTH) and Time to Fill (TTF) settings
Please be sure to read the content within the settings so that you fully understand the calculations and criteria used.