What can this Dashboard do for you?
The Jobs Dashboard is made up of a series of infographics which show activity relating to jobs.
Each infographic can be tailored, as always, using the quick-date ranges at the top of the page.
![]()
Please note - all of these infographics can only present data when a minimum of 7 days date-range is selected.
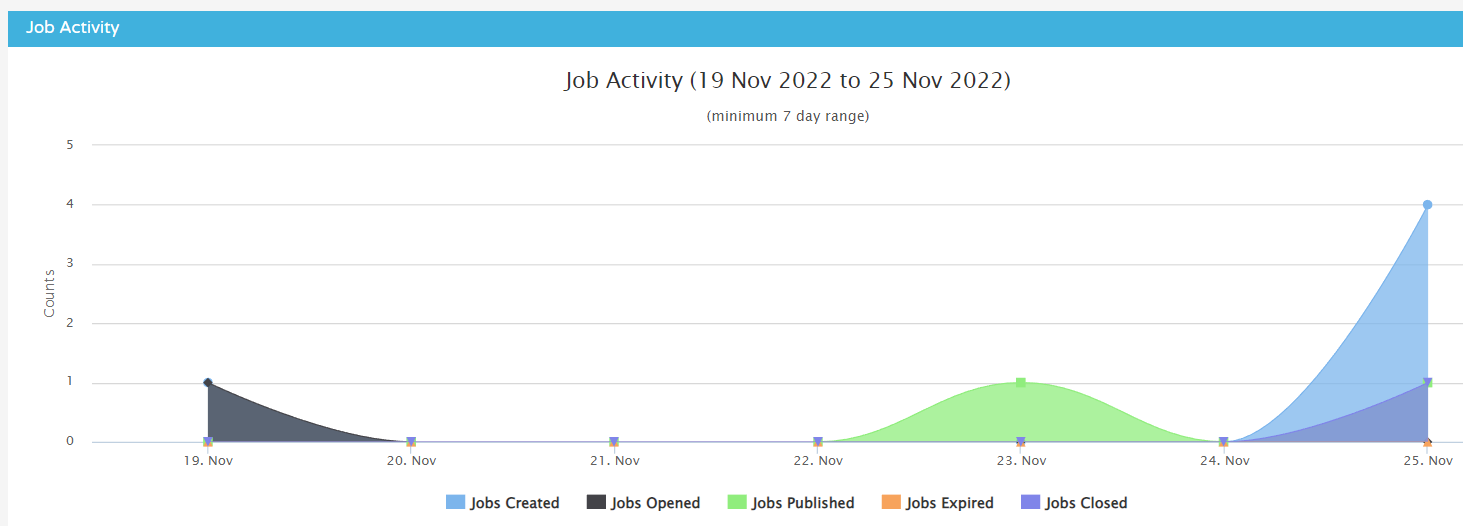
The first graph shows you the job activity, in relation to
- Jobs Created
- Jobs Opened
- Jobs Published
- Jobs Expired
- Jobs Closed
The data can be manipulated by selecting one of the options underneath the axis at the bottom:
- Select the relevant status and it will become shaded in grey and it will no longer appear on the graph
- Select it again to show the information
The other graphs on the Dashboard show:
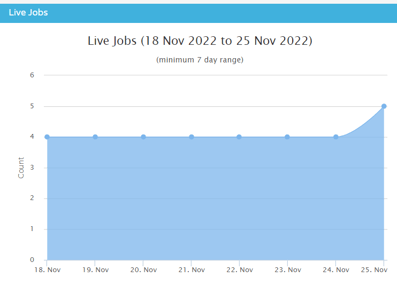
Live Jobs
- Here you can see how many live jobs have been present on the ATS on any given day
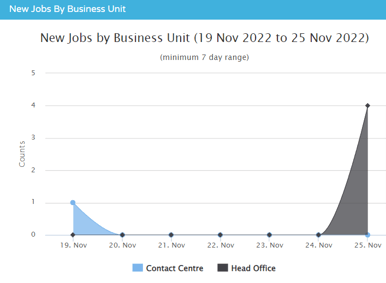
Jobs by Business Unit
- Here you can see jobs that have been posted relating to a specific Business Unit
- You can select an option underneath the bottom axis to change the data presented (i.e. the selected one will turn grey and be removed from view. Select again to show the data again.)
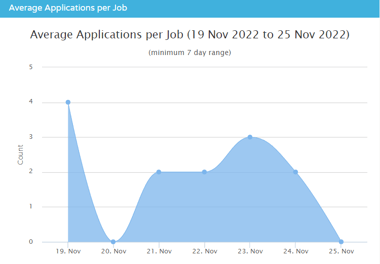
Average Applications per job
- Here you can see how many applications have been received on average, per job, per day
- This allows you to see when your most popular days are for receiving applications - these figures might help you decide when is the optimal time to post new jobs
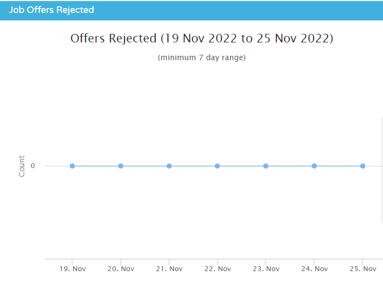
Job Offers Rejected
- This shows you how many job offers have been rejected by the candidate
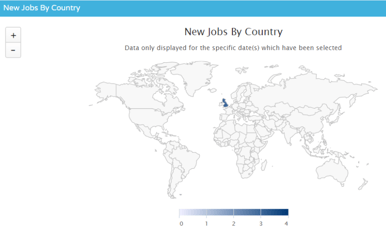
New Jobs by Country
- This shows you how many jobs have been posted according to country
- If you are an international business, this graph will show you more than just the UK figures
- You can zoom in to the map to see specific countries - if any jobs have been posted for a specific country, it will turn blue on the map
- You can zoom in either by scrolling with your mouse while hovering over the map, or by using the zoom controls on the left-hand side of the map
- If you hover over a country, it will turn green and will display how many jobs have been posted for this country
- As always, the data can be changed by selecting a different date range at the top of the page
As always, Custom Filters can be applied to the Dashboard:
![]()
The filters that can be applied in this instance include:
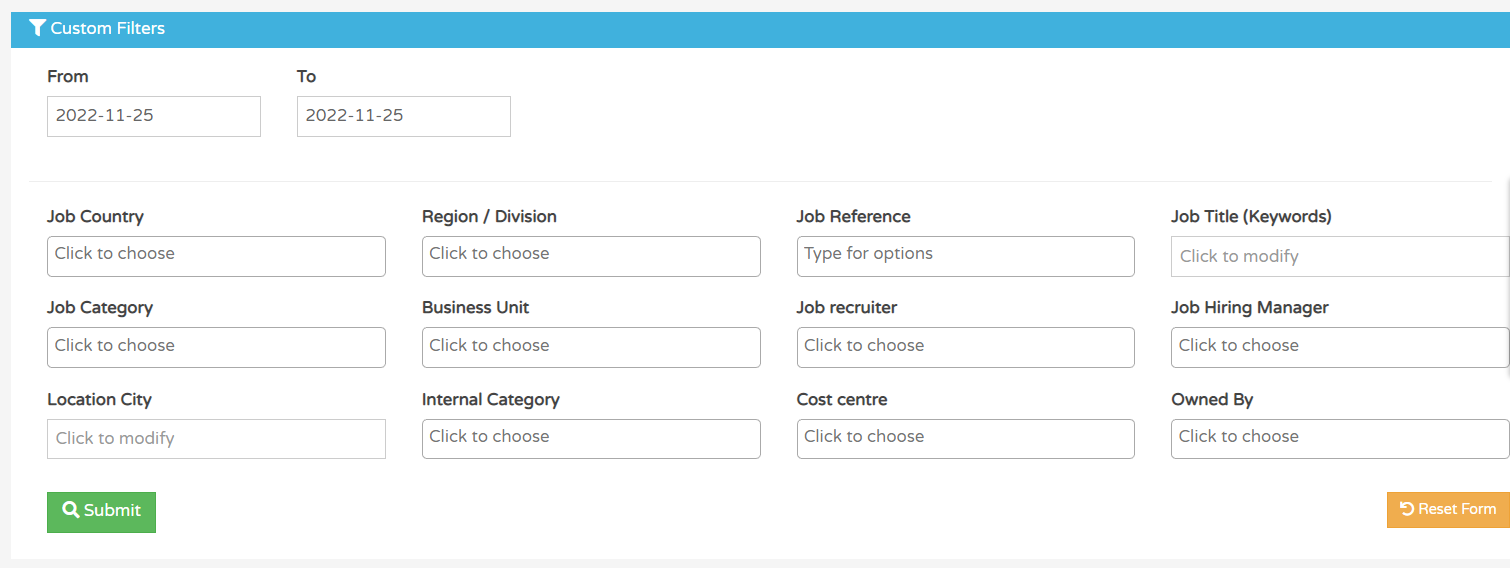
- Multiple options can be applied to each filter by typing a key word or phrase in each field and selecting the relevant option(s).