What can this report do for you?
This report shows a summary of the sources where visitors and candidates have arrived from.
All visits to the ATS are included in these numbers. This may include:
- Recruiters
- Super Users
- Agencies
We are only able to report on visits that can be tracked as standard. Any users who use an 'Incognito browser' or ad-blocking or proxy server blocking technology will be excluded from our reporting figures.
Please note - Source data is not shown in real-time. It takes around 72 hours from the application being submitted, to Tribepad being able to present the data to you.
You will initially see two infographics:
Visits by Calculated Source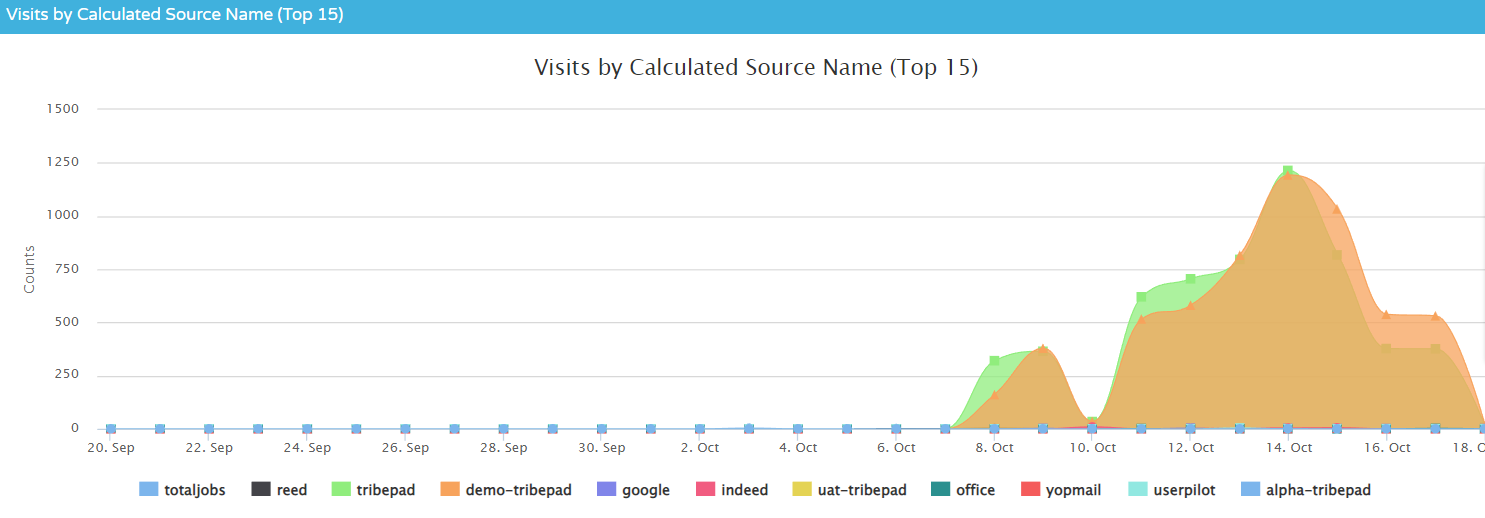
- A 'Calculated Source' refers to any avenue a candidate has originated from. This could be:
- A Job alert that has been sent to a candidate
- A referral by a candidate/internal colleague for another candidate
- 'Invites to apply' that have been sent by recruiting
- Job Boards
- Referral websites (for example Google if a candidate has searched for 'x company jobs' and has been redirected to your ATS)
- Calculated Sources take into consideration any Tags or referral sources
- Tags can be added to a URL when sharing a job with a candidate
- Tags will always take precedent over referrer sources, i.e. they will show higher up in the 'top 15' ranking
- The elements in the infographic can be viewed or hidden by clicking on the labels underneath the chart
Applications per day
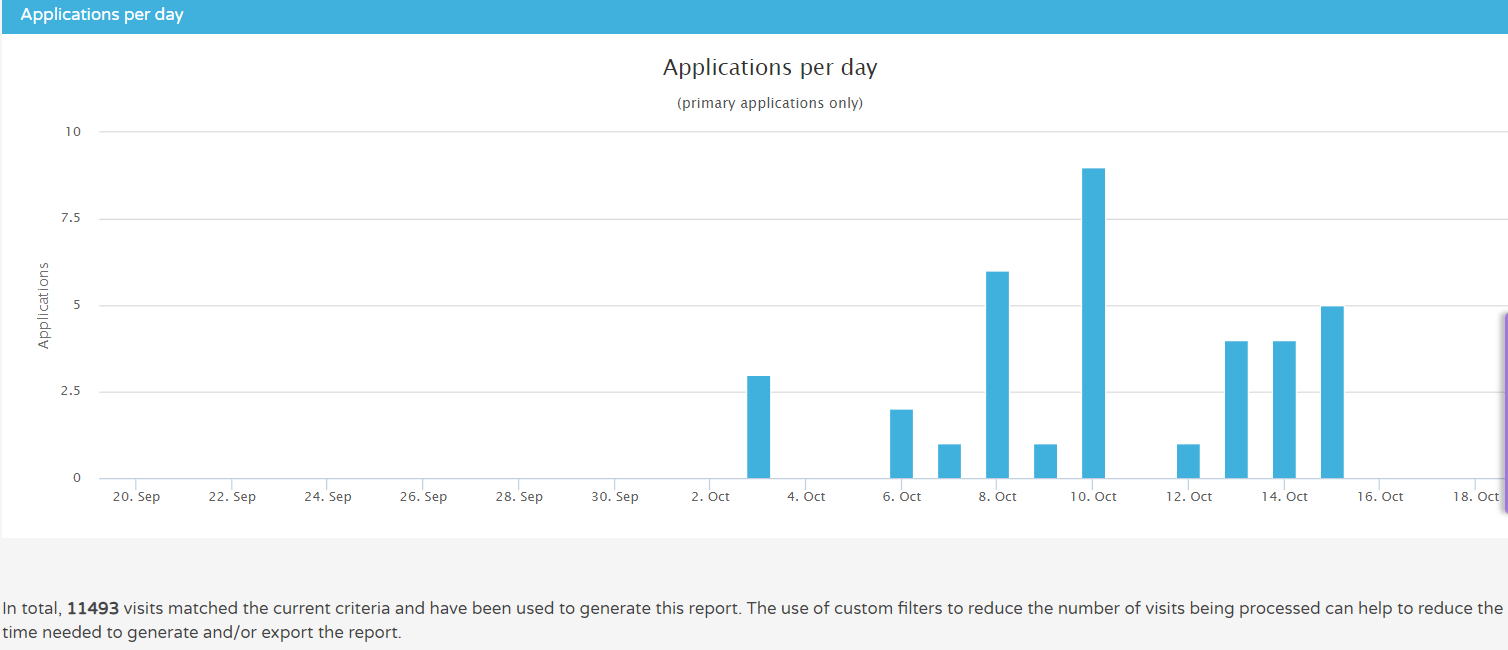
- The Applications per day only focuses on applications that have been created as part of a single visit
- An individual may cause more than one visit to be logged if they switch between devices or if they stop browsing for more than 30 minutes. After 30 minutes,the visit will end
- The visits also include everyone who has accessed the ATS in the specified time period
- The text underneath the chart states how many visits have been reviewed to generate the report - if there is a significant number of visits compared to the number of applications, it might be helpful to look at more detail who is visiting the ATS. You can see this in the raw data in the report further down the page.
Notes are occasionally added to reports or infographics, to give you further context around the circumstances used to create a report.
They are always worth reading for more information!

At the bottom of the page you will see the raw data generated.

The columns that are included present the following information:
- Referrer Domain Count
- How many visitors have originated from the specific source
- Jobboard Count
- How many visitors have originated from the specific job board
- Campaign Count
- How many visitors have originated from the specific campaign
- Total Visits
- How many visits in total from the specific source
- This refers to anyone who has viewed from the specific source and could include internal colleagues
- Total Unique Visitors
- This refers to individual people, not the amount of visits.
- This data is driven by user IDs or IP addresses
- Total Unique Registered Visitors
- How many of the unique visitors have registered on the ATS at some point
- Total visits where user has signed up
- How many people created an account during that specific visit
- Total visits where user created application(s)
- How many people created an application during that specific visit
- This total will be lower than the total number of visits as it only concerns completed applications
- Average page views per visit
- How many pages were accessed per individual visit
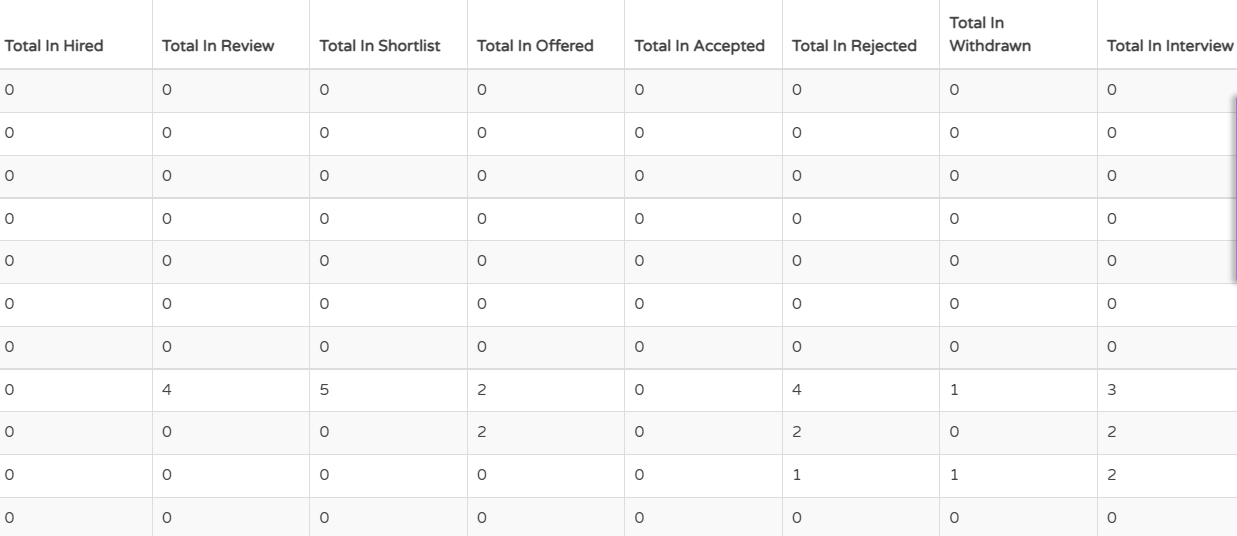
Scrolling across the page details the different stages of the recruitment process and how many candidates originating from the different sources, are at each stage:
Certain columns have blue hyperlinks - as always, these hyperlinks will link to further information regarding that data
- Each of these hyperlinks links to the specific source detailed in the 'Calculated Source Name' column on the left
In the example below, the hyperlink in the 'Total Visits' column links to the 'Tracking : Visits List' for Tribepad: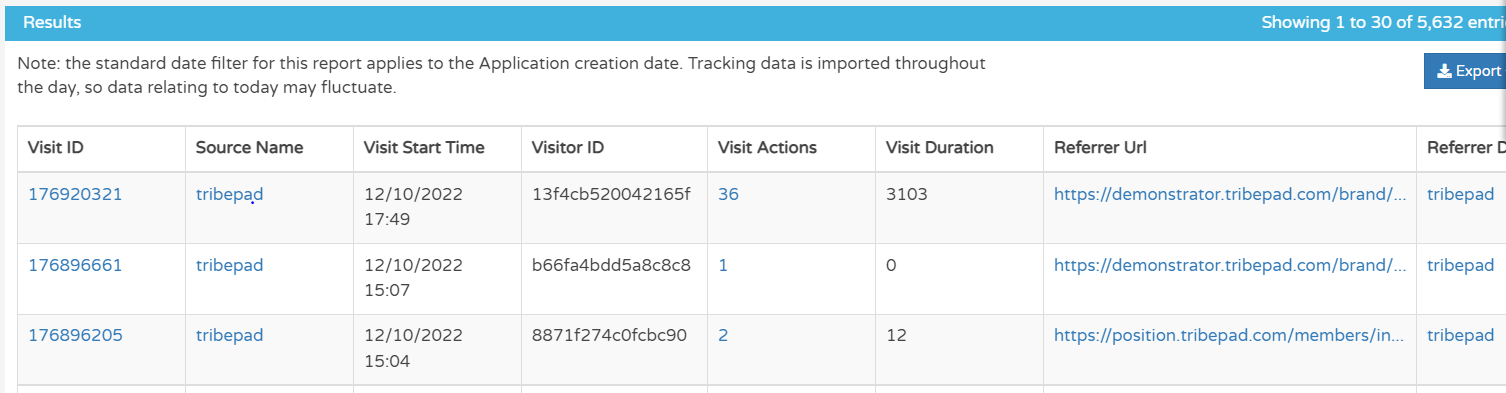
On every report you can apply Custom Filters to manipulate the data your way. This is done at the top of the page and the button is alongside the quick-access date-ranges:
![]()
Filters that are specific to this report include:
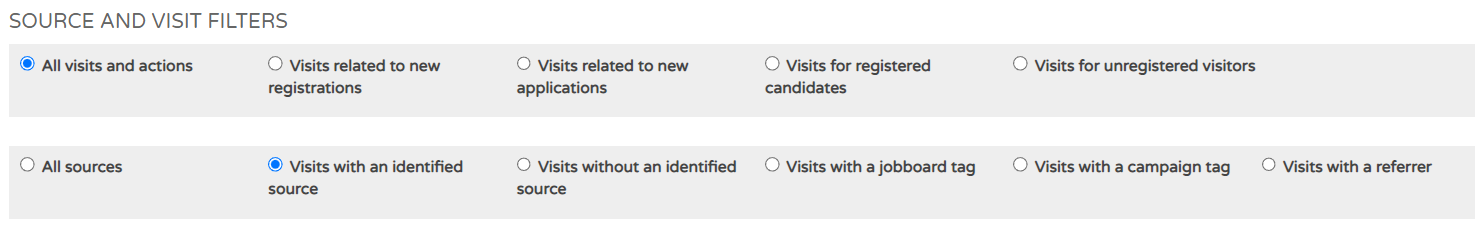
'Identified sources' here refers to sources that we are able to track. As per the information at the top of the page, we cannot track information on Incognito browsers or where ad-blocking or proxy server technology is in play.