A look into the infographics that are displayed via the Source Dashboard
Key Figures
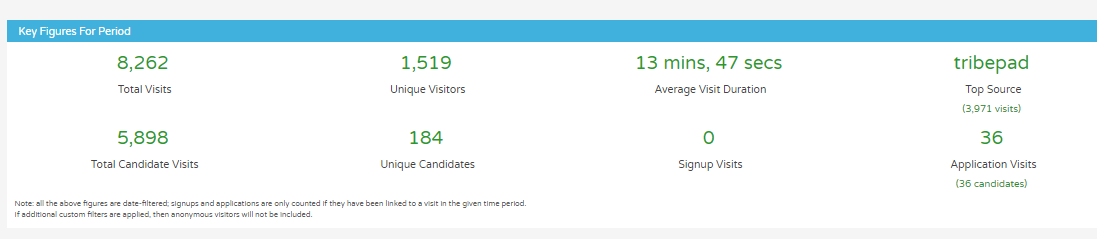
The first widget you see provides you with key information based on sources. Here you can see:
- Total Visits
- Unique visitors
- Average visit duration
- Top Source
- Total candidate visits
- Unique Candidates
- Sign up visits
- Application visits
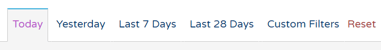
As always, these can be filtered according to the quick-access date-range filters at the top of the page:
Traffic Overview
The next infographic shows you the Traffic overview at a glance.This shows the total number of actions, visits and visitors to your ATS in the given time period.
- A visitor may visit multiple times, and there may be multiple actions in a visit.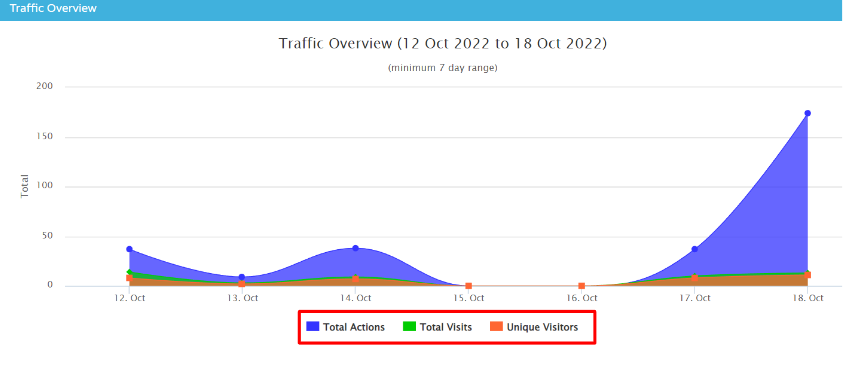
- The different elements in the infographic can be viewed or hidden by clicking on the element label underneath the chart.
Job Applications by Source (Top 15)
This provides the total number of role applications per day by source i.e. via Job Board, Referral etc.
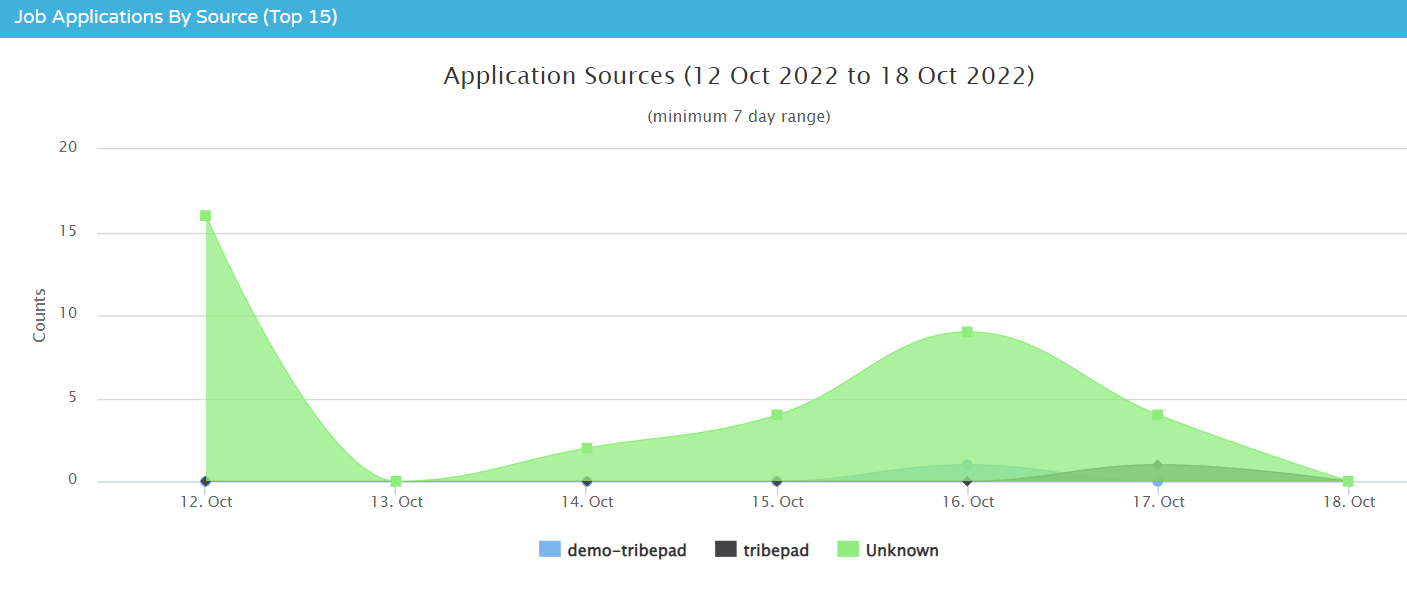
- Again, the elements can be viewed or hidden by clicking on the labels underneath.
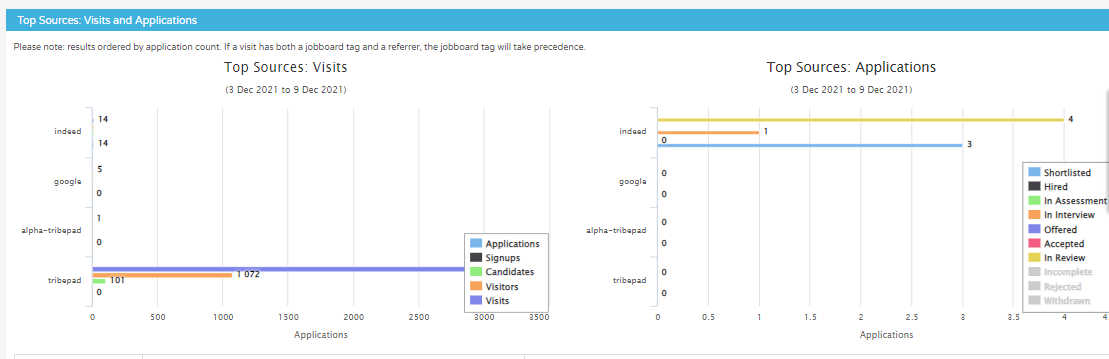
Top Sources visits and applications
This shows the source with the greatest results for application and visits
- Again, the view can be changed by clicking on the different element labels.
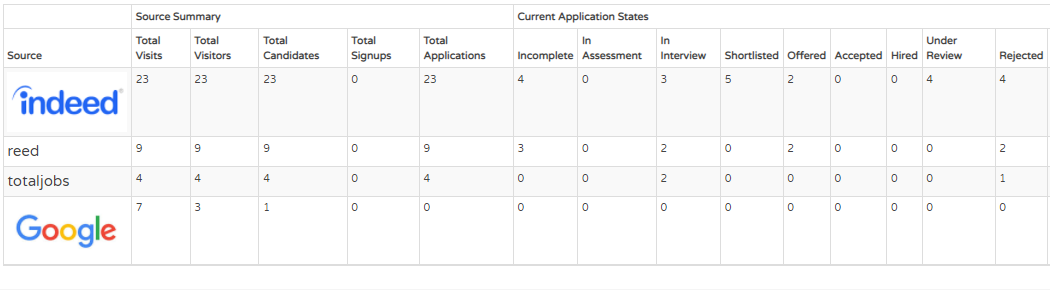
Source Summary
This shows specific source information including the amount of candidates hired from a certain source, to total applications and sign ups
- This is a great resource for any board pack meeting.
Top Campaign Tags
Shows the Campaign with the greatest results.
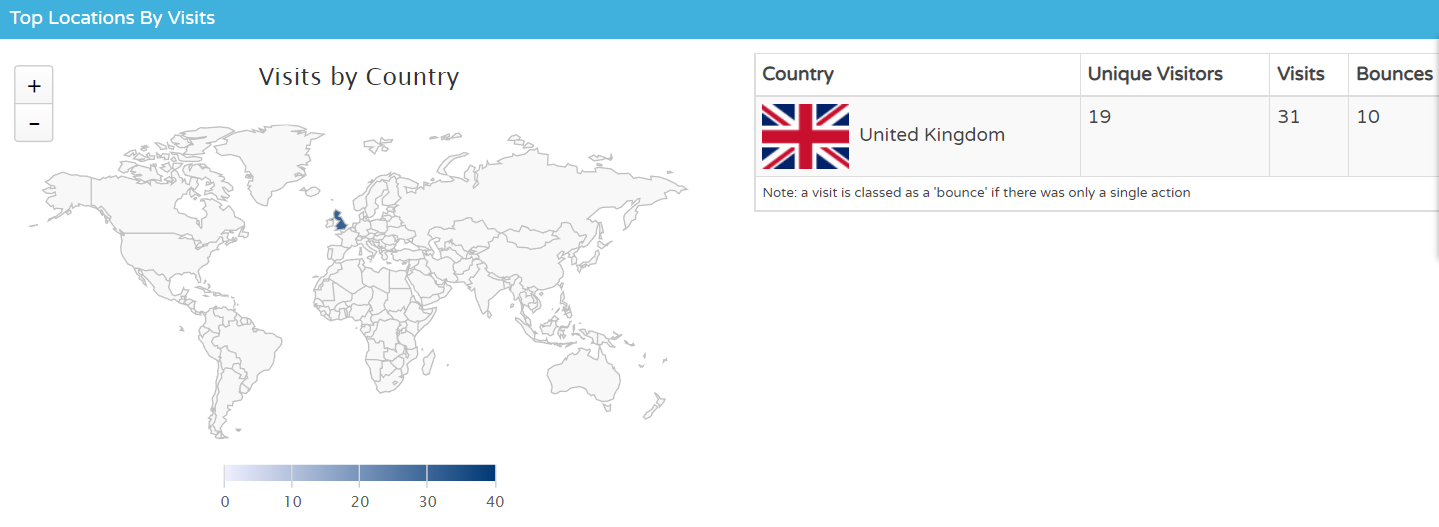
Top Locations by Visits
This provides the number of visits per Country
- ‘Bounces’ means that only one page was visited and therefore only one action recorded.