In this report, you can use the tabs across the top to filter and drill down into downloadable graphs based on trends within your ATS. Each bar chart will show you separate information. These include:
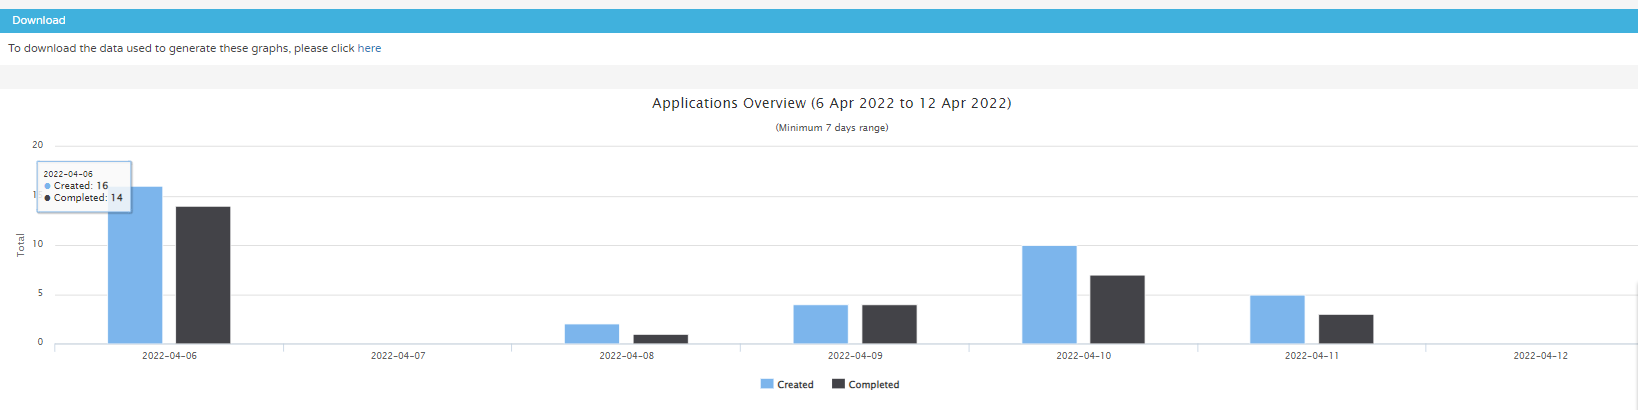
Applications Overview:
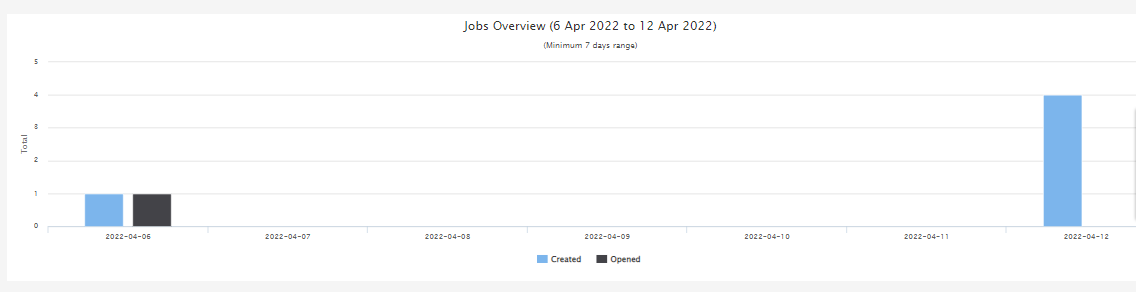
Jobs overview:
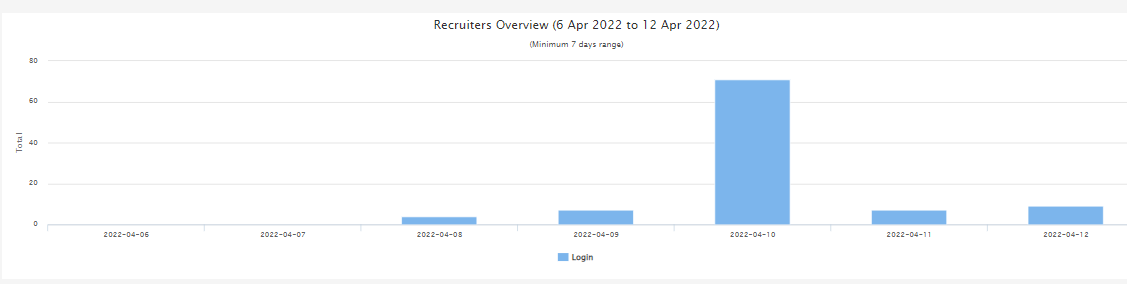
Recruiters Overview:
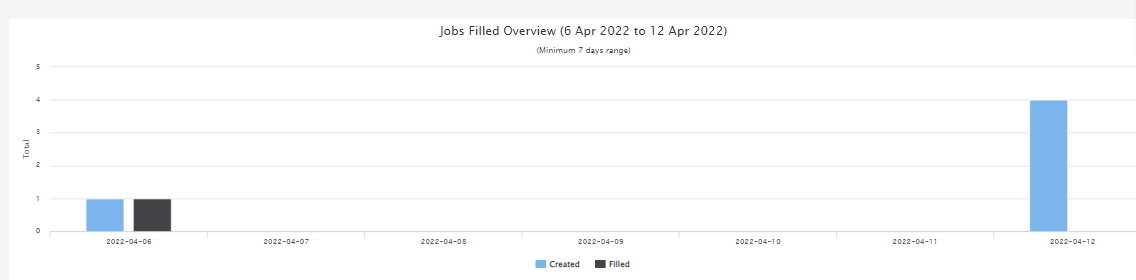
Jobs Filled Overview:
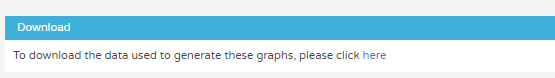
To download these graphs see the below which sits above the graphs:
Tabs across the top:
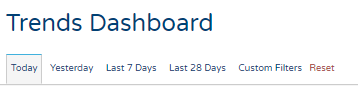
You can utilise the tabs across the top which have many different uses. The first 4 tabs as you can see below are there to quickly filter your report based on:
- Today
- Yesterday
- Last 7 days
- Last 28 days
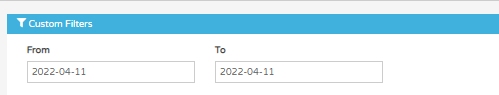
Custom Filters:
In this section, you can use a more precise date range filter by selecting the relevant dates using the handy calendar selection.
Trend Reporting Granularity:
In this section, you can choose a filter that will look at daily, weekly and monthly figures.

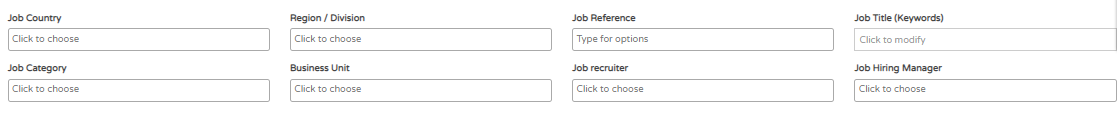
Selectable filters based on job-specific information:
In this section, you can drill down even further by the following below. You can search for jobs owned by a certain recruiter or a job title using keywords to bring back a more defined report.
Trend Historical Overlay:
In this section, you can check the tick box for the overlay data from twelve months earlier. Please note that this can impact loading times, and can only be used with the daily or monthly views

Once you have made the selections using the filters above you can now "submit" to run the report with these now added. You will see your graphs information has now changed.